


In 2008, the LOTOS Group announced an updated strategy for 2008-2012, which was the basis for determining the strategic aims of the upstream segment:
- The total production of the upstream segment will reach at least 10% of the oil processing in the LOTOS Group in 2012 and will exceed 20% of the production by 2015 with the upward trend in the following years.
- The outlays for this purpose may reach 5.1 billion PLN in 2006-2012.
The steps taken by the upstream segment of the LOTOS Group in 2008 were aimed at fulfilling the above strategic aims. The steps included the acquisition of and search for licenses on the Norwegian Continental Shelf and exploration and development work in the Baltic Sea. The crisis suffered by the global economy in the second part of 2008 did not change the aims or the main strategy directions; only the pace of fulfilling certain tasks was changed.
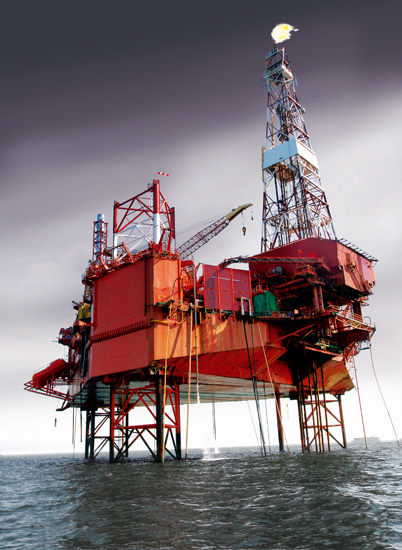
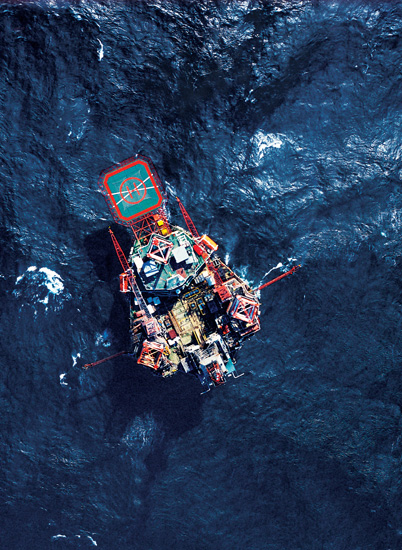
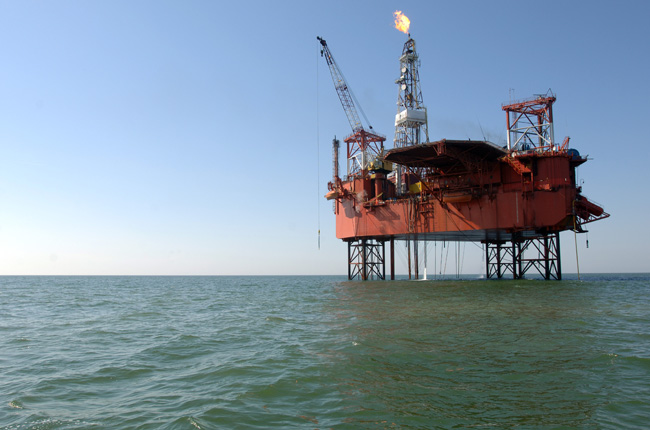
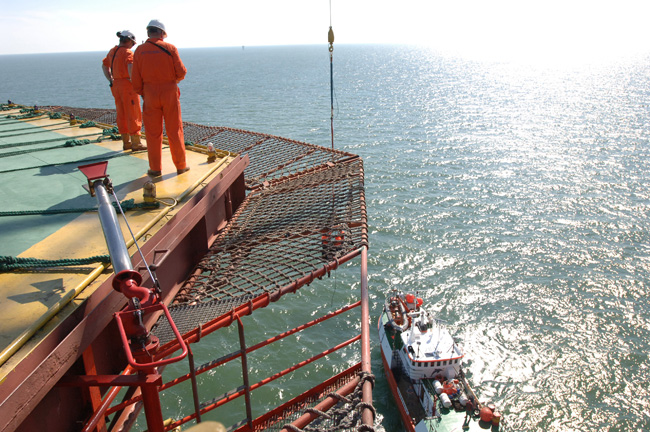
The key company of the upstream segment in the LOTOS Group is ‘Petrobaltic’ Petroleum and Gas Exploration and Production Joint Stock Company. Petrobaltic is the focus of all the work in oil and gas exploration and production performed by the LOTOS Group. The Petrobaltic Group encompasses LOTOS Norge, which concentrates on exploration and production on the Norwegian Continental Shelf and the UAB Naftos Gavyba, involved in production in Lithuania. Petrobaltic is in charge of exploration and production in the Polish economic sea zone in the Baltic Sea.
Operating Results in 2008
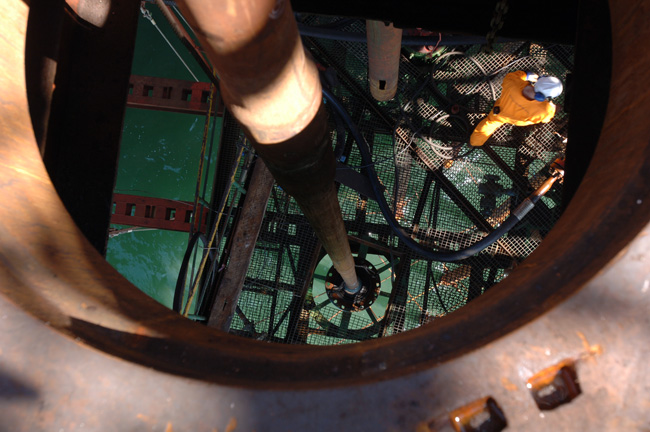
In 2008, Petrobaltic produced almost 285 thousand tonnes of petroleum and gas, i.e. 15% more than planned. This result was the effect of production at the Sea Oil Mine on the B3 field and the development work on B8, which was being prepared for production on an industrial scale. The oil produced during the work performed on this field had a major impact on the global production of Petrobaltic.
| 2006 | 2007 | 2008 | |
|---|---|---|---|
| Petroleum (tonnes in thousands) | 265.5 | 190.6 | 257.8 |
| Gas (Nm3 in millions) | 29.9 | 21 | 29.3 |
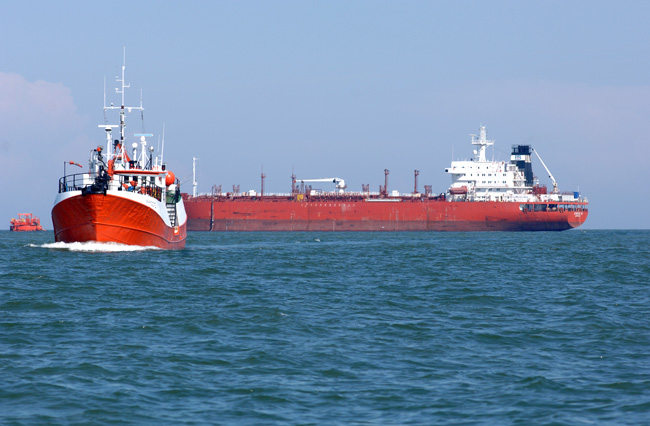
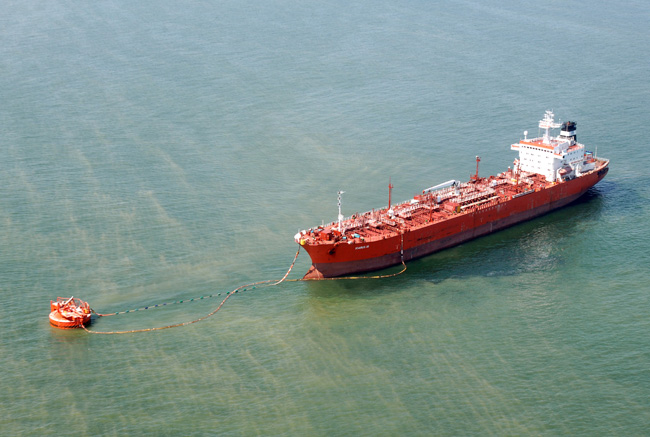
Owing to high production and record petroleum prices on global markets, in 2008 Petrobaltic generated the highest incomes and profits in its history (approximately PLN 226 million).
| 2006 | 2007 | 2008 | |
|---|---|---|---|
| Volume of petroleum sold (tonnes in thousands) | 247.9 | 208.8 | 227.5 |
| Total incomes (PLN in millions) | 424.4 | 377.7 | 480.8 |
| Gross profitability | 60% | 50.40% | 59.60% |
 Consolidated Cash Flow Statements